Explain, Watch, Act, Score.
Kelynto is an enterprise planning intelligence platform for retail planning organizations. It does one job each week: it drafts the business review your planners owe leadership, with the evidence behind every cause, and then measures whether the draft was any use.
Four parts, one weekly loop.
Each part is a screen your planners use. The pictures are the product, running on a synthetic retailer.
01 Explain
What happened last week and why, with evidence
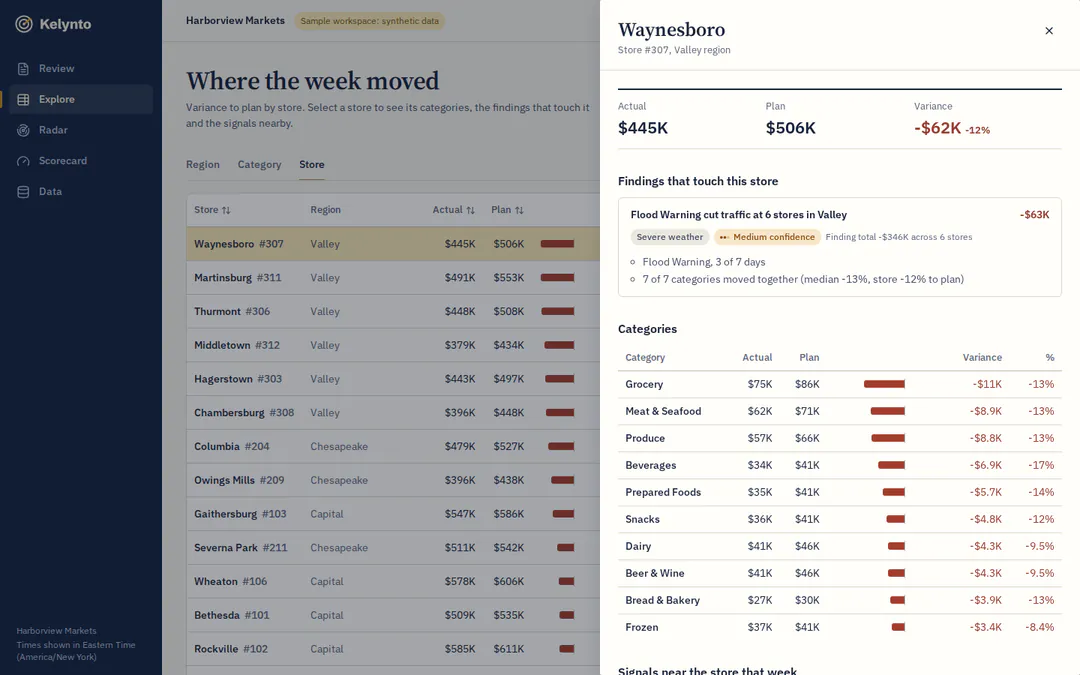
Actual against plan, how much of the movement is explained, a written commentary, and each cause ranked by size with its stores and what was observed at each. The same variance can be followed down by region, category and store.
Variance without a supported cause is listed as not yet explained. Nothing is forced onto a weak cause.
02 Watch
What is coming near your stores
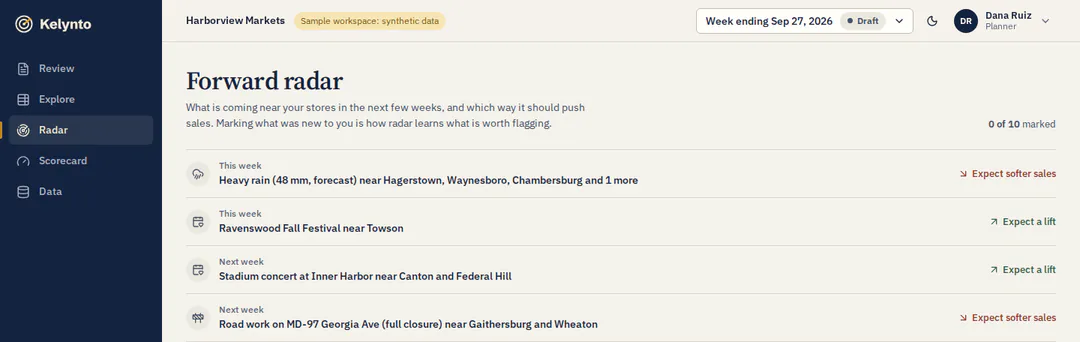
Forward Radar lists weather, local events, road work and competitor openings in the next three weeks, the stores each one touches, and which way it should push sales.
Direction only. It is not a forecast and does not change your plan. Each call is scored against what sales did afterwards.
03 Act
The planner decides, and the decision is kept
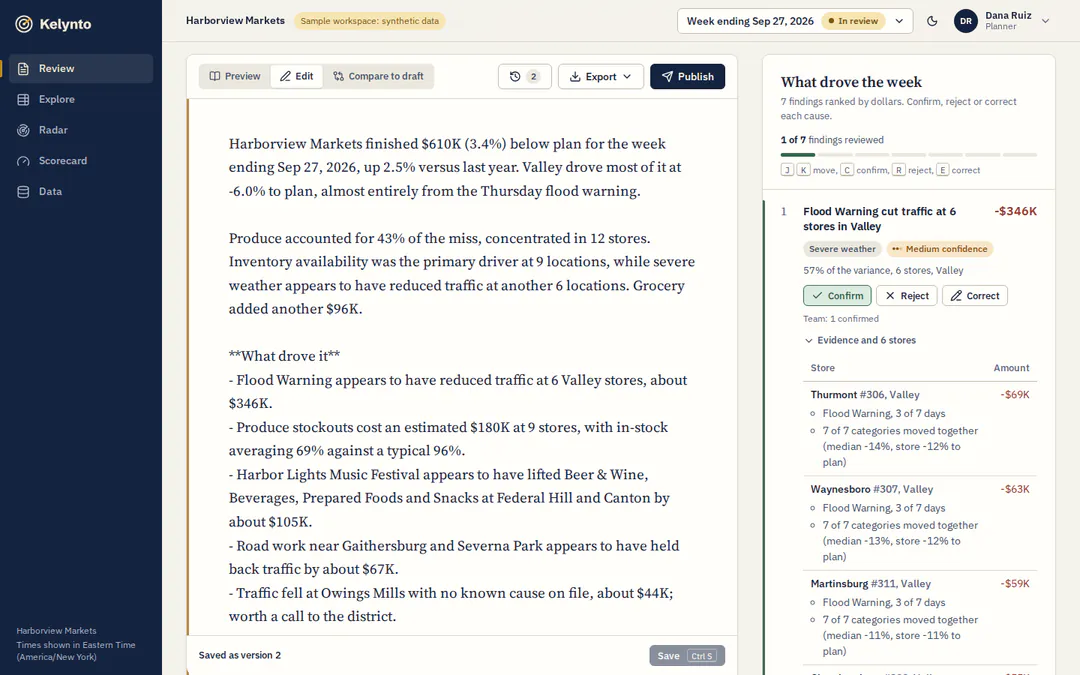
Your planner rewrites what they know better, then confirms, rejects or corrects each cause. Every version is kept. The published review can be copied into email or slides, downloaded, or printed.
Each confirmation, correction and publish is recorded with who made it and when.
04 Score
Whether it is earning its place
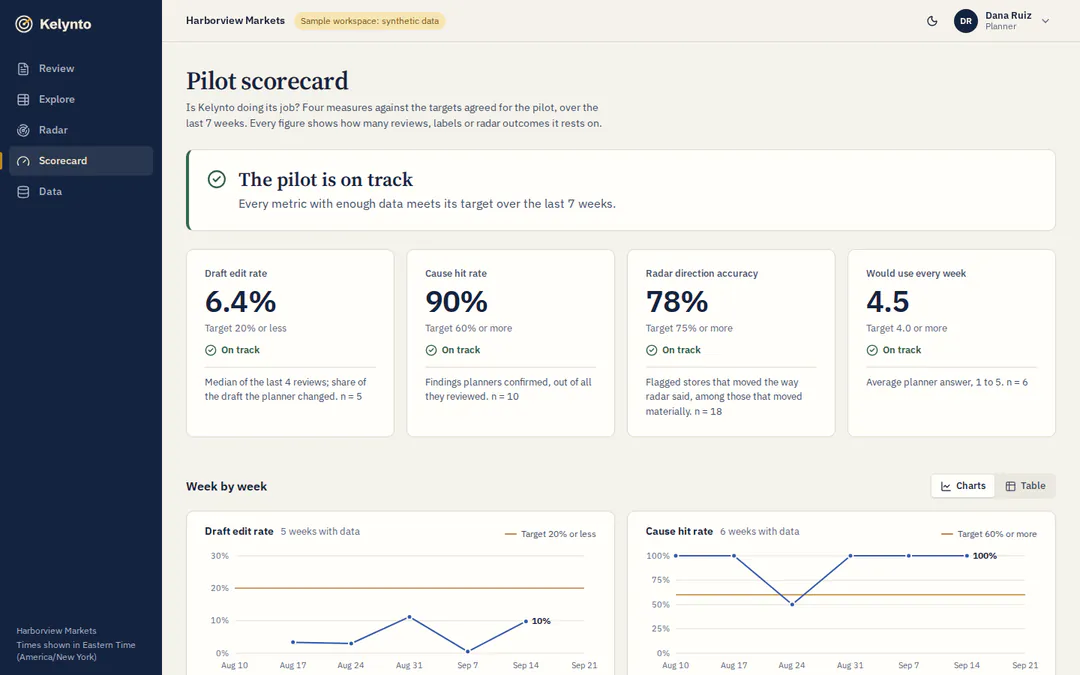
Four measures, taken from what your planners actually did: how much of the draft they rewrote, how many causes they confirmed, how often the radar pointed the right way, and whether they would use it every week.
Each figure shows the number of reviews, labels or outcomes it rests on, and reads "insufficient data" until there are enough.
Screens show Harborview Markets, a demonstration retailer with synthetic data and simulated planner reviews. The figures on them are not results.
Product tour.
Nine real screens from the sample workspace, in the order a week runs. Nothing here is a mock-up.
The sample workspace itself is not open to visitors yet. See it running in a 20-minute walkthrough.
Prefer to click through it yourself? Explore the sample workspace.
-
Step 1 of 9
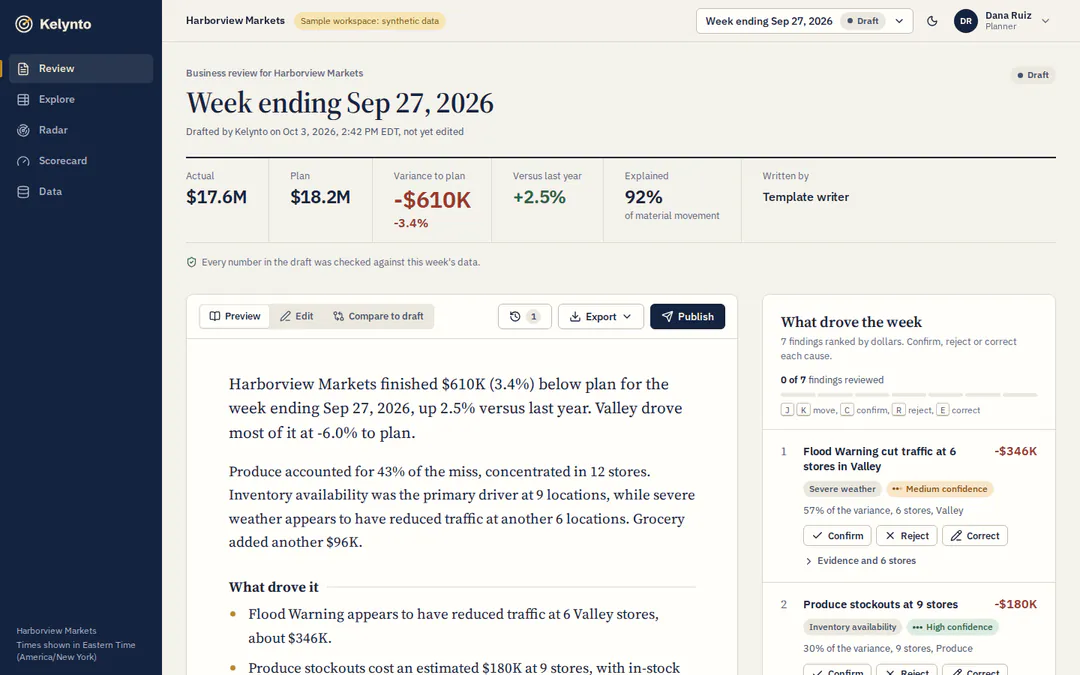
The draft is waiting
The week opens on a drafted review: actual, plan, variance, and how much of the material movement is explained. A line under the figures confirms that every number in the draft was checked against the week's data.
The planner reads it before changing anything.
-
Step 2 of 9
Check each cause against its evidence
Each finding opens to the stores behind it and what was observed at each: here a flood warning on 3 of 7 days, with all seven categories moving together. Confidence is shown as high, medium or low.
The planner confirms, rejects or corrects each cause, and edits the commentary in place.
-
Step 3 of 9
Follow a number down to the store
Explore shows where the week moved by region, category and store. Opening a store lists the findings that touch it and how each of its categories did against plan.
The planner answers "which stores?" without leaving the review.
-
Step 4 of 9
See what is coming near your stores
Forward Radar lists what is ahead in the next three weeks and the stores each item is near. It says which way to expect sales to move, and nothing more precise than that.
The planner marks each item as new to them, already known or not relevant.
-
Step 5 of 9
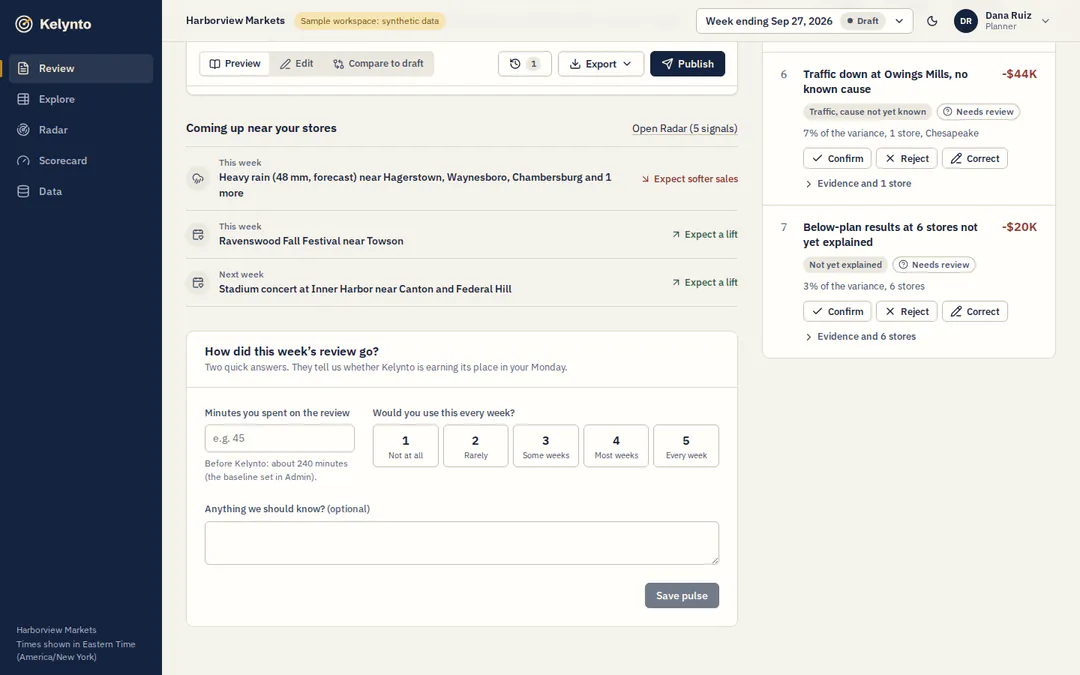
Two questions before publishing
The review ends with the week's radar preview and two questions: how many minutes the review took, and whether the planner would use this every week, from 1 to 5.
Those two answers feed the scorecard.
-
Step 6 of 9
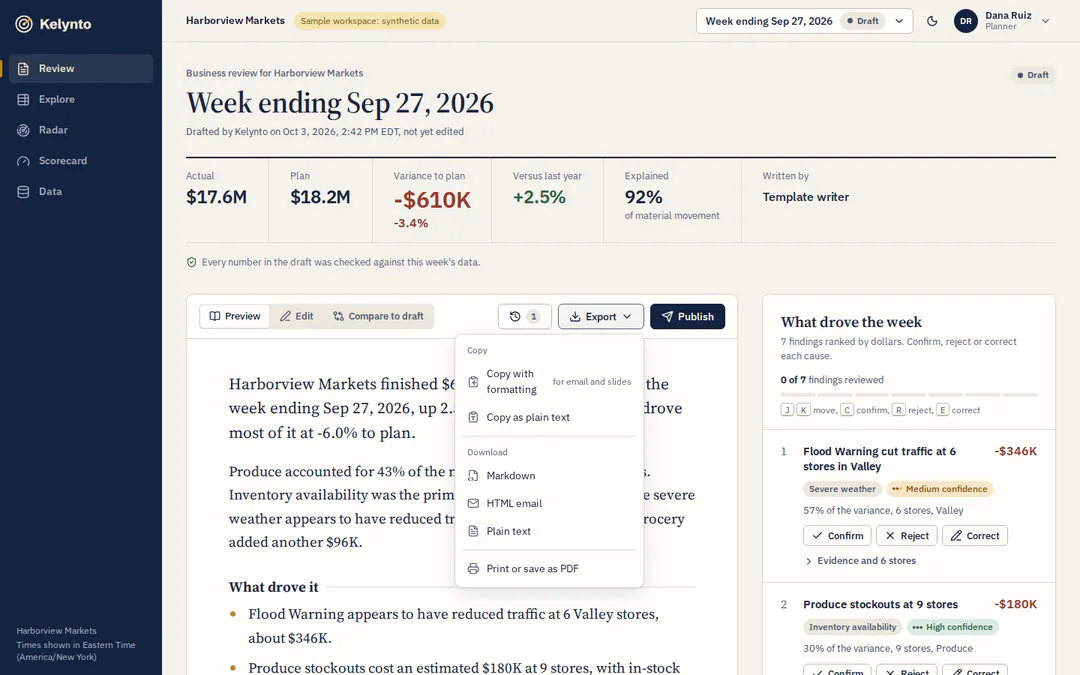
Publish and send it up
The review can be copied with formatting for email and slides, copied as plain text, downloaded as Markdown, HTML email or plain text, or printed.
The planner sends leadership the review in the form they already use.
-
Step 7 of 9
Check whether it is earning its place
The scorecard holds the four pilot measures against their targets, each with its sample size. The figures on this screen come from synthetic data with simulated reviews. They are not results.
The planning leader reads this, not a vendor's claim.
-
Step 8 of 9
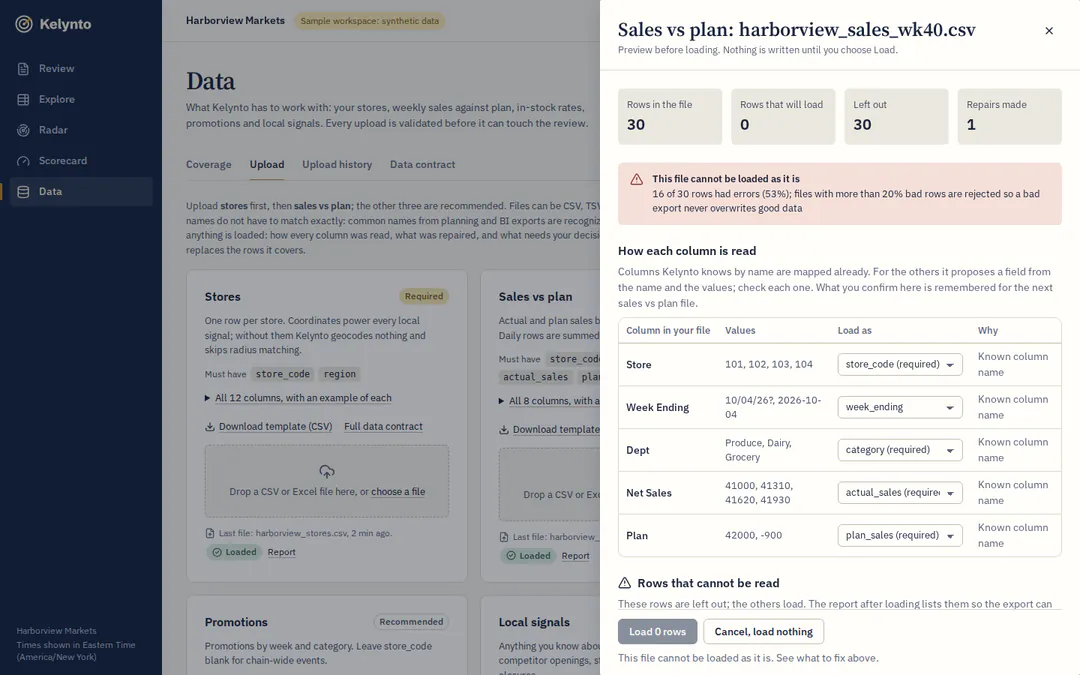
When an export is wrong, it says exactly where
Every upload is checked and shown before anything is loaded. This file had unreadable dates and text where numbers belong, so nothing was loaded and the existing data was left unchanged. The preview shows how each column was read and names the rows that cannot be read.
The analyst fixes the export and uploads it again.
-
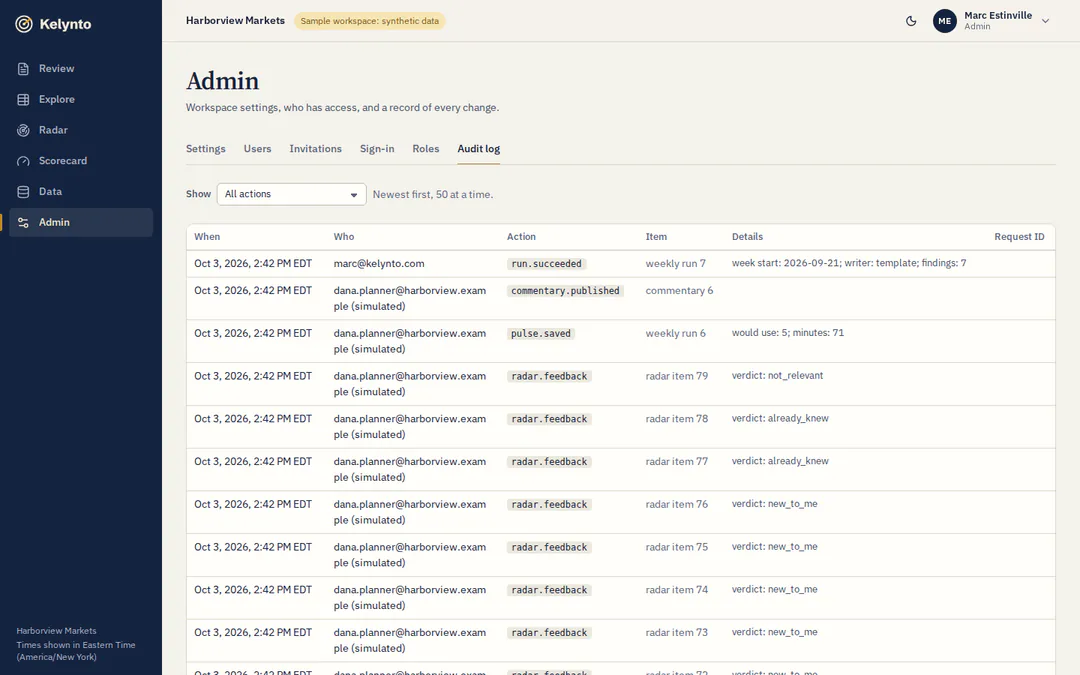
Step 9 of 9
Every change is on the record
The audit log lists runs, edits, publishing, cause labels and radar verdicts: who, what, which record and when. In the sample workspace the planner's history is simulated, and the log marks those lines as simulated.
The admin can show who changed what.
Alongside your planning system.
Kelynto replaces nothing you run today and writes nothing back to it.
- It explains variance to the plan you already have. It does not forecast, replenish, allocate, price or order.
- Files in. A store list and weekly sales against plan by store and category, as CSV or Excel with your own column names.
- Or a scheduled export. Your planning system or warehouse can post the weekly file to an upload endpoint. No agent is installed on your side.
- No built-in connectors. There is no integration with any planning suite or ERP today.
What leadership gets.
The same review, sooner, with its reasoning attached.
- A written review by region, category and store, in the planner's own final words.
- The stores behind every cause and what was observed at each.
- An honest remainder. The share of the week that is not yet explained is stated, not hidden.
- A scorecard that shows whether the tool is earning its place, on your own weeks.
What it does not do.
The job is narrow on purpose. If you need one of these, look elsewhere.
- No forecast and no plan. Radar gives a direction, never an amount, and nothing feeds a forecast.
- No dashboards and no ad hoc questions. It is not a BI tool and not a chatbot over your data.
- No item-level analysis. It works on weekly totals by store and category. It does not model cannibalisation, halo, price elasticity or assortment changes.
- No trained model behind the causes. Attribution is rules with stated priors, so every finding can be read and challenged.
- No fiscal period roll-up. Reviews are weekly. There is no 4-5-4 month or period view today.
- No accuracy figure. None exists on real retailer data, so none is quoted. How results will be reported.
Read how Kelynto weighs evidence, or see the four measures a pilot is judged on.
Four ways to take the next step.
-
Explore
See the product
The sample workspace is not open to visitors yet. The product tour shows nine real screens from it.
A private copy of a synthetic retailer, Harborview Markets. No conversation needed first.
-
Evaluate with your data
Run it on your own weeks
A backtest on your past weeks, then about six live Monday reviews, judged on four measures agreed before it starts.
Create a workspace and load your own files. Sign in by an emailed link. No password to create.
-
Deploy in your environment
Check the architecture
What runs where, what crosses the boundary, and how far each path has been proven. Azure first.
-
Talk to us
Twenty minutes with the founder
Your process and your questions. Or write to marc@kelynto.com.
Kelynto is an early-stage company opening its first pilots with retail planning teams. The product is built and tested on synthetic data. There are no customers and no results yet, and this site says so wherever it matters.